This case comes from Emanuel Rojas's professional experience before he founded My Data Intelligence. For confidentiality reasons, the company's name and figures are omitted; the values in the tables are for illustration only.
A market left underserved.
After the pandemic, the electrical cable market changed quietly but deeply. Mexican manufacturers, which had historically competed strongly in the region, shifted their capacity to the United States, where demand and prices were more attractive.
In the case of flexible cables, those competitors started selling them only, or almost only, in the United States. The result was a regional market with growing demand and less available supply.
Demand kept rising, even with higher prices.
At the company, we started to notice something in the numbers: incoming orders for flexible cables were rising month after month. The decision was made to raise the price, and demand kept growing.
When a price increase does not slow demand, the data is telling you that the market values the product more than you are charging for it.
The question was no longer whether to adjust prices, but how to do it in a systematic, fair and profitable way.
Production and sales, in one view.
The first step was to bring together two areas that usually work separately. We designed a pricing system that connected the utilization of each production line with the market price:
- If a line was running at full capacity, we analyzed the trend in incoming orders for the products it made.
- If demand kept rising against limited capacity, the price had to reflect that scarcity.
- If a line had available capacity, price could be used to attract volume.
This way, price stopped being an isolated decision and became a response to what was happening in the plant and in the market.
Not all customers contribute the same.
The second step was to understand the customers. We built an ABC segmentation based on four criteria:
- Share of the product portfolio: what percentage of the product portfolio each customer bought.
- Payment behavior: whether they paid on time.
- Contribution margin: how much margin their purchases generated.
- Purchase frequency: whether they bought every month.
For frequency, we used a very simple measure: a monthly variable worth 1 if the customer bought that month and 0 if not. Adding it up over the last 12 months, a customer with 12 bought every month; one with 6 bought half of the time (50%), and so on.
- Portfolio
- High share
- Payment
- Always on time
- Margin
- High
- Frequency
- 12 out of 12 months
- Portfolio
- Medium
- Payment
- Usually on time
- Margin
- Medium
- Frequency
- 8 to 11 months
- Portfolio
- Low
- Payment
- Irregular
- Margin
- Low
- Frequency
- Fewer than 8 months
Illustrative values.
With this classification, each customer received treatment consistent with the value they brought to the business.
A clear and adjustable pricing matrix.
With the segmentation in place, we designed the central tool: a pricing matrix. On the vertical axis, the product family and cable type; on the horizontal axis, customers grouped into categories A, B or C; and in each cell, a percentage over the country's price list.
Each country served had its own monthly price list, indexed to the price of copper. The matrix was applied on top of that list.
| Cable family and type | A customers | B customers | C customers |
|---|---|---|---|
| FlexibleType 1 | +1% | +3% | +5% |
| FlexibleType 2 | +1% | +3% | +5% |
| Building wireType 1 | 0% | +2% | +4% |
| PowerType 1 | 0% | +2% | +4% |
Illustrative values.
If the cell for an A customer and flexible cables showed 1%, that customer paid the price list plus 1% on that product. If it showed 3%, they paid the list plus 3%. This way, every price was explained and easy to adjust.
The 1% that confirmed the reading.
In one of the adjustments, an additional 1% was applied to the base matrix in every country: for example, A customers started paying the list price plus 1%.
What could have looked like a risk turned out to be a lesson: demand was not affected. And since every increase over the price list goes straight to contribution margin (the cost does not change), that small percentage became pure margin, multiplied by the volume of every country.
A different offer for each segment.
The segmentation was not used only for pricing. It also defined the service level:
| Segment | Price | Delivery time |
|---|---|---|
| A customer | Best | 1 week |
| B customer | Intermediate | 2 weeks |
| C customer | Highest | 3 weeks |
This way, the best customers received a better price and better service, and the capacity of a fully loaded plant went first to those who brought the most value.
The improvement in contribution margin did not come from a single decision, but from a method: read demand, connect it with plant capacity, segment customers with objective criteria, and turn it all into a clear and adjustable pricing matrix.
Why price is the most powerful lever.
What we did has a name: Revenue Growth Management (RGM). It is the discipline of growing revenue and margin profitably, using data to make decisions about price, product mix, customer segmentation and commercial terms.
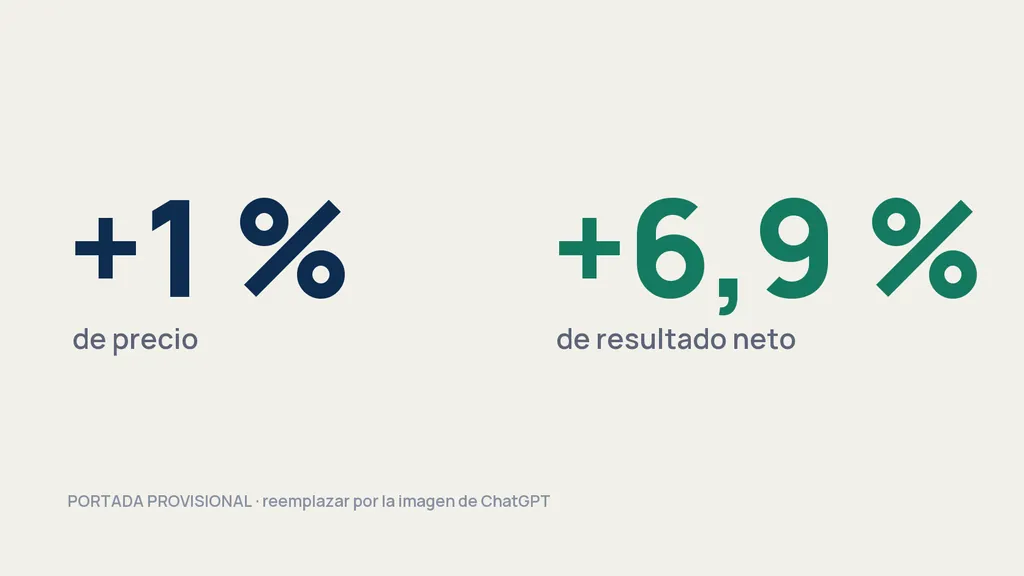
To understand why price is so powerful, consider a fictitious company that sells a single product, has annual sales of USD 6,438,000, a contribution margin of 29.4% and net income of 10.2%. We compare two scenarios with the same volume: raising the price 1% or cutting variable cost 1%.
| Item | Base | +1% price | −1% variable cost |
|---|---|---|---|
| Sales | 6,438,000 | 6,502,380 | 6,438,000 |
| Variable cost | 4,545,228 | 4,545,228 | 4,499,776 |
| Contribution margin | 1,892,77229.4% | 1,957,15230.1% | 1,938,22430.1% |
| Selling expenses | 322,079 | 322,079 | 322,079 |
| Administrative expenses | 268,399 | 268,399 | 268,399 |
| Logistics and warehousing | 214,719 | 214,719 | 214,719 |
| Depreciation | 89,466 | 89,466 | 89,466 |
| Operating income (EBIT) | 998,109 | 1,062,489 | 1,043,561 |
| Financial expenses | 60,000 | 60,000 | 60,000 |
| Income before taxes | 938,109 | 1,002,489 | 983,561 |
| Income tax (30%) | 281,433 | 300,747 | 295,068 |
| Net income | 656,67610.2% | 701,74210.8% | 688,49310.7% |
| Change in net income | — | +6.9% | +4.8% |
Fictitious figures for illustration only. Variable cost includes raw materials, direct labor and freight.
Try it yourself.
Move the slider to see how much the same company's net income grows with each lever.
What does this exercise tell us?
- A 1% price increase raises net income by almost 7%. Every additional dollar of price goes straight to margin, because neither costs nor expenses change.
- A 1% cut in variable cost raises it by about 5%. It is valuable, but it has less impact, because it applies to a smaller base than sales.
- Cutting costs usually requires negotiations, investments or changes in operations. Adjusting the price with data, with well-segmented customers, can be done in a single price list update.
That is the essence of RGM: price is not just a number on a list; it is the most direct lever on profitability, as long as it is managed with data and not by instinct.
What a small or mid-sized company can apply starting tomorrow.
You do not need to be a multinational to apply these ideas:
- Watch the trend in your orders. If demand rises even when the price goes up, you are probably leaving money on the table.
- Segment your customers with data. With four simple variables (volume, payment, margin and frequency) you can already build an ABC classification.
- Use a pricing matrix. A percentage over a base list makes prices consistent, easy to explain and easy to update.
- Differentiate your service too. Price is not the only lever.

Founder of My Data Intelligence. Heredia, Costa Rica.