
Power BI report automation

Stop managing by instinct.

Your billing system tells you how much you sold. It does not tell you how much cash is sitting idle in your warehouse, how much you lost because a product was out of stock, or who has owed you money for 90 days. Our dashboard does.
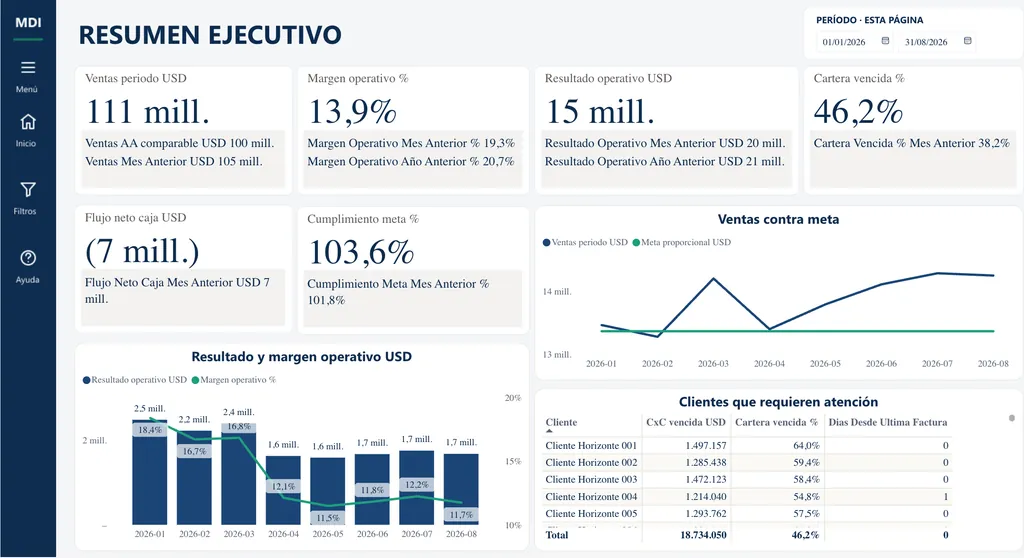
Power BI demo dashboard with the executive summary: sales, operating margin, cash flow, overdue receivables and customers that need attention (sample data, in Spanish).

Actual screenshot of the demo dashboard, with sample data.

We start by proving it

The found-money assessment.

Using your own data, we deliver three numbers in the first week.

₡ Idle inventory

The value of inventory that has not moved. You choose the cutoff: 3, 6, 12 or 24 months.

₡ Lost sales

What you could not sell last quarter because products were out of stock.

₡ Receivables at risk

Overdue accounts receivable, by customer and by age.

Guarantee: if we do not find opportunities worth at least 5 times the monthly service fee, the assessment is free of charge.

Your business at your fingertips

The 8:00 PM report.

Every night, in your inbox, at the time your business closes. You go to bed knowing exactly how the day ended, wherever you are.

  • Today's sales, split between cash, card and credit.
  • A comparison with the monthly target.
  • An actionable alert, for example: "customer X's invoice for ₡450,000 became overdue today".
  • Interactive or PDF: if you use the dashboard, the email takes you straight to it; if you do not need it, you receive a PDF with the day's indicators.
Hardware store owner reads on his phone the report he received by email at closing time.

Modules by department

Your whole business, in one view.

The dashboard is built around the departments of your company. Swipe to see each module.

Finance

Never be surprised by your cash position.

  • Projected cash flow for 8 to 13 weeks, with a traffic light for weeks at risk.
  • Cash conversion cycle: how many days your money is tied up.
  • Receivables and payables aging by customer, supplier and salesperson.
  • Break-even point: the exact day your sales cover your fixed costs.
  • Real margin by product line, brand and branch.

Sales

Sell more to the customers you already have.

  • Performance against target and last year by product line, brand, salesperson and branch.
  • Customers you are losing: who stopped buying or is buying less.
  • Margin and discounts by salesperson: who meets the target by giving away margin.
  • Quotes to sales and the reason a sale was lost.
  • Average ticket and 80/20 analysis of customers and products.

Purchasing and inventory

Where the hidden money is.

  • Inventory without movement from 1 to more than 24 months.
  • Sales lost to stockouts: days without stock times daily sales.
  • GMROI: margin earned on every colón invested in inventory.
  • Purchases against sales, so you do not build up obsolete stock.
  • Suppliers and inventory accuracy: deliveries, prices, shrinkage and adjustments.

Warehouse and logistics

Deliver on time and in full.

  • Order picking time.
  • Orders delivered on time and in full to the customer.
  • Shipping cost by weight, volume and as a percentage of sales.
  • Profitability by route.

Human resources

Your team's real productivity.

  • Staff turnover.
  • Time to hire.
  • Sales per labor hour.
Veterinarian serves a customer and his dog at the counter, next to bags of pet food.

For veterinary clinics

Predictable recurring revenue.

  • Pet food repurchase cycle: the system predicts when each customer will run out of food and creates the list of WhatsApp reminders.
  • Vaccination and deworming schedule: future revenue already on the calendar; active versus inactive patients.
  • Services versus products mix and how full the veterinarian's schedule is.

Applied artificial intelligence

An advisor that never sleeps.

Purchase suggestions by product

How much to order and when, taking seasonality into account: no excess stock piling up and no shortages that cost you sales.

Customer loss prediction

A prioritized list of who to call this week, before you lose them.

Automatic cross-selling

"Customers who buy paint also buy brushes": concrete recommendations for the sales counter.

Anomaly detection

Unusual discounts, cancellations and atypical inventory movements: fraud control.

How the service works

A monthly subscription, with no upfront software investment.

  1. 1

    We connect to your current system

    Billing, Excel or accounting. You do not have to change anything.

  2. 2

    We build the dashboard

    Around the departments of your business, and we keep it updated automatically.

  3. 3

    You receive the daily report

    In your inbox, at your closing time: with a link to the dashboard or as a PDF.

  4. 4

    We review the findings every month

    With you or your management team, and the indicators evolve with your business.

Frequently asked questions

What clients usually ask us.

Do I need to change my billing system?

No. We connect to your current system (billing, Excel or accounting) and build the dashboard on the data you already have.

Is there an upfront software investment?

No. The service is a monthly subscription, with no upfront software investment.

How does the daily report reach my inbox?

A scheduled process reads the day's indicators from the same model that powers your dashboard and emails them to you at your closing time. If you use the interactive dashboard, the email includes the summary and a link to open it; if you do not need it, you receive a PDF with the day's indicators. This way the report and the dashboard always match.

How long does the found-money assessment take?

Using your own data, we deliver three numbers in the first week: idle inventory, lost sales and receivables at risk.

What happens if the assessment does not find opportunities?

If we do not find opportunities worth at least 5 times the monthly service fee, the assessment is free of charge.

A simple decision

If the assessment does not find at least 5 times the value of the service, do not hire us.

If it does, the dashboard pays for itself from the first month.