
A few years ago I bought a printer on sale. It was so cheap that I almost felt guilty. Two months later the ink ran out, and a new set of cartridges cost almost as much as the whole printer.
My first reaction was to think I had been cheated. My second, with an analyst's mindset, was different: the manufacturer never intended to make money on the printer. It wanted to make money on the ink. The printer was just the way in.
That has a name: it is a business model. And here is the uncomfortable question for you, as a manager or business owner: do you know exactly how your business makes money? Not how much it sells, but at what moment, with which customer and why that sale is profitable.
Four questions that define a business model
At the University of St. Gallen, Oliver Gassmann and his team studied hundreds of companies and found that almost all of them repeat a small number of patterns. Four questions are enough to describe any of them:
- What do you offer the customer?
- Who do you offer it to?
- How do you produce and deliver it?
- Why is it profitable?
The fourth question is the one most often forgotten, and it is precisely the one you measure with data. Below I present 13 of these patterns, with examples you already know and the three key performance indicators (KPIs) that tell you whether each one is doing well or not. I grouped them into five families to make it easier to recognize yours.
How to read the cards: each indicator shows the signal that it is going well and the signal that it is going badly. If you or your analyst want the calculation, open "See formula". Reference figures are guidelines only; each company should set its targets based on its industry and its history.
Family 1: earning on repurchase

These models give up profit on the first sale to secure the following ones. Their risk is always the same: that the customer does not come back.
Razor and Blade: they give you the machine and charge you for the coffee
You buy a capsule coffee machine at a good price. Six months later you have spent more on capsules than you paid for the machine, and you will keep buying as long as you use it. The manufacturer accepts a small profit, or even a loss, on the equipment, because the profit is in every repurchase. Printers do the same with ink, and Gillette does it with replacement blades.
The three numbers
- Consumables revenue per active unitGoing well: stable or rising. Going badly: it falls because customers switch to generic products.
See formula
consumables revenue ÷ active installed base - Repurchase rate (attach rate)Going well: high and stable. Going badly: more units with no repurchase.
See formula
units with consumables purchases within 90 days ÷ units sold - Time to recover the equipment subsidyGoing well: recovered in less than 12 months. Going badly: it exceeds the useful life of the equipment.
See formula
subsidy per unit ÷ monthly consumables margin per customer
Warning sign: revenue per unit drops because your customers switched to generic cartridges or capsules.
Subscription: the customer pays before using
Microsoft 365 stopped selling its software once and started charging for it every year. Dollar Shave Club delivers razors to your door every month, and Blacksocks does the same with identical black socks. The customer pays a fixed fee and the company gains something very valuable: revenue it can predict.
The three numbers
- Net monthly recurring revenue (MRR)Going well: it grows month after month. Going badly: flat or falling.
See formula
new MRR + expansion − contraction − canceled - Monthly cancellation rate (churn)Going well: low and falling. Going badly: rising; customers leave faster than they arrive.
See formula
subscribers who cancel ÷ subscribers at the start of the month - Customer lifetime value versus acquisition cost (LTV:CAC)Going well: 3 to 1 or more. Going badly: less than 1 to 1; growth destroys value.
See formula
customer lifetime value ÷ cost to acquire the customer
Warning sign: many new customers arrive, but they leave faster than they come in. It is like filling a bucket with a hole in the bottom.
Flat rate: all you can eat
A buffet charges the same to someone who eats one plate as to someone who goes back four times. Unlimited mobile plans and all-inclusive hotels work the same way. The business works because customers who consume little make up for those who consume a lot.
The three numbers
- Margin per customerGoing well: positive on average across the customer base. Going badly: negative in a growing segment.
See formula
fee − cost of each customer's consumption - Share of heavy usersGoing well: a controlled minority. Going badly: heavy users dominate the base.
See formula
customers above the profitability threshold ÷ total customers - Cancellations by consumption levelGoing well: low, especially among light users. Going badly: light users leave and costly users stay.
See formula
customers who cancel ÷ customers at the start, by consumption level
Warning sign: light customers leave and the heaviest users stay. The average looks fine until it suddenly does not.
Family 2: giving away to sell

Freemium: most people do not pay, and that is fine
You listen to Spotify for free, with ads between songs. You design in Canva without paying anything. You hold Zoom meetings until the free version cuts off your call. In all three cases, the company gives away the basics, hoping that some users will want more and pay for it.
The key is that the paying minority covers the cost of serving everyone else. If very few make the jump, the model becomes a very expensive act of charity.
The three numbers
- Free-to-paid conversionGoing well: 2–5% or more (software benchmark). Going badly: less than 1%; the free version is enough.
See formula
new paying users ÷ active free users - Daily versus monthly active users (DAU/MAU)Going well: the base grows and keeps using the product. Going badly: sign-ups that never return.
See formula
daily active users ÷ monthly active users - Cost of free users versus paid revenueGoing well: paid revenue comfortably covers free users. Going badly: the ratio approaches or exceeds 1.
See formula
cost of serving free users ÷ revenue from paying users
Warning sign: the free version is so good that nobody needs the paid one.
Family 3: connecting others

These companies make money by getting others to work together. What they sell is the connection, and they hold little or no inventory of their own.
Peer-to-Peer: the business of introducing two strangers
Airbnb does not own the homes. Uber does not own the cars. eBay does not own what is sold on its site. All three connect a person who has something with another person who needs it, and charge a commission on every exchange.
The three numbers
- Gross merchandise value (GMV)Going well: steady monthly growth. Going badly: flat or concentrated in a few users.
See formula
sum of the value of transactions between users - Share the platform keeps (take rate)Going well: stable without losing volume. Going badly: it erodes; users close deals outside the platform.
See formula
platform revenue ÷ GMV - Market liquidityGoing well: high, with little time between listing and transaction. Going badly: supply without demand, or the reverse.
See formula
listings with a transaction ÷ listings published
Warning sign: users meet on the platform and then do business outside it.
Revenue sharing: growing with other people's sales force
Apple keeps a percentage of every app sold in its App Store. YouTube shares advertising revenue with the creators who fill the platform with videos. Amazon pays a commission to any website that refers a sale. In every case, external partners bring customers or content in exchange for a share of the revenue.
The three numbers
- Share of revenue brought in by partnersGoing well: it grows without depending on a single partner. Going badly: concentrated in a few partners.
See formula
revenue from partners ÷ total revenue - Margin after paying commissionsGoing well: positive and stable. Going badly: commissions eat up the profit.
See formula
(revenue − partner commissions − costs) ÷ revenue - Partners that actually generate salesGoing well: a high active share. Going badly: a large but inactive network.
See formula
partners with sales in the period ÷ registered partners
Warning sign: the partner network looks large on paper, but three partners bring in almost all the business.
Crowdsourcing: the community does the work
Every time you report an accident on Waze, you are working for Waze for free. LEGO fans propose new sets on LEGO Ideas and others vote on which ones get made. Wikipedia exists because thousands of volunteers write it. The company obtains ideas, content or data it could never pay for with its own payroll.
The three numbers
- Active contributorsGoing well: a growing community. Going badly: it depends on a few contributors.
See formula
users who contribute in the period, and the trend - Share of useful contributionsGoing well: high quality. Going badly: a lot of noise.
See formula
contributions accepted ÷ contributions received - Cost per useful contributionGoing well: lower than doing it with your own staff. Going badly: equal to or higher than the internal cost.
See formula
cost of incentives and moderation ÷ useful contributions
Warning sign: filtering out the noise costs more than what the community contributes.
Family 4: removing intermediaries and costs

These models do not invent a new product. They make money by removing someone or something from the path: the distributor, the store or the employee who serves the customer.
Direct sales: from the manufacturer to your home
Dell grew by building computers to order and selling them without stores. Avon has sold through catalogs for decades, with representatives who go door to door. Tesla sells its cars without dealerships. By removing the intermediary, the company keeps that margin and also gets to know each customer firsthand.
The three numbers
- Gross margin per orderGoing well: higher than the margin through distributors. Going badly: in-house logistics eats up the margin.
See formula
(price − cost − logistics) ÷ price - Cost to acquire each new customer (CAC)Going well: recovered on the first or second purchase. Going badly: each customer costs more than they bring in.
See formula
sales and marketing spend ÷ new customers - Repurchase rateGoing well: the direct relationship builds loyalty. Going badly: one-time customers.
See formula
customers with 2 or more purchases ÷ total customers
Warning sign: in-house logistics eats up the margin taken back from the distributor.
E-commerce: the store that never closes
Amazon, Shein and the online store of the small business around the corner share the same logic: without a physical store, fixed costs go down and reach goes up. The extra advantage is that every click can be measured, from the visit to the payment.
The three numbers
- Conversion rateGoing well: 1–3% or more (retail benchmark). Going badly: traffic that does not buy; abandoned carts.
See formula
orders ÷ site sessions - Average order valueGoing well: stable or rising. Going badly: it drops, and shipping weighs more on every order.
See formula
revenue ÷ number of orders - Return on advertising spend (ROAS)Going well: it covers the margin and shipping costs. Going badly: you sell more but earn less.
See formula
attributed revenue ÷ advertising spend
Warning sign: you sell more every month but earn less, because each sale costs more in ads and shipping.
Self-service: the customer does the work and pays less
At IKEA you find the box in the warehouse yourself, take it home and assemble the furniture. At a fast-food restaurant you stand in line, pour your own drink and pick up your tray. At the supermarket you scan your groceries at the self-checkout. In exchange for that work, you pay a lower price.
The three numbers
- Operating cost per transactionGoing well: lower than in an assisted model. Going badly: it rises; the savings do not materialize.
See formula
operating costs ÷ transactions handled - Self-service adoptionGoing well: high and growing. Going badly: customers ask for help or give up.
See formula
self-service transactions ÷ total transactions - Customer satisfaction (CSAT)Going well: the low price makes up for the effort. Going badly: complaints about the work passed on to the customer.
See formula
satisfied customers ÷ customers surveyed
Warning sign: customers feel they are doing the company's work and the price does not make up for it.
Digitization: when selling one more unit costs almost nothing
Printing and delivering a newspaper costs paper, ink and fuel; sending it to one more digital reader costs almost nothing. The same happened with the bank branch versus the banking app, and with the printed book versus the e-book. When products move from atoms to bits, the cost of each additional unit falls almost to zero.
The three numbers
- Share of revenue from the digital channelGoing well: it grows and so does the total. Going badly: digital takes sales from the physical channel without growing the total.
See formula
digital channel revenue ÷ total revenue - Marginal cost per unitGoing well: close to zero; the margin scales. Going badly: platform costs grow with volume.
See formula
variable cost of serving one additional digital unit - Active digital usersGoing well: high and recurring use. Going badly: downloads or sign-ups without use.
See formula
users with activity in the period ÷ registered users
Warning sign: digital grows, but it only takes sales away from the physical channel and the total does not increase.
Family 5: charging for the intangible

In these models, what is most valuable cannot be touched: a feeling or a piece of data.
Selling experiences: the coffee is just the excuse
A coffee at Starbucks costs several times what it costs to make at home. What the customer pays for is the armchair, the Wi-Fi and an hour of quiet work. Disney does not sell admission tickets; it sells a day the family will remember. Whoever buys a Harley-Davidson also buys a lifestyle and a club to belong to.
The three numbers
- Net Promoter Score (NPS)Going well: positive and high; above 50 is excellent. Going badly: negative; the experience falls short.
See formula
% promoters − % detractors - Price premium the customer acceptsGoing well: you charge more without losing volume. Going badly: you have to discount to sell.
See formula
your price ÷ average market price of the basic product - Returning customer rateGoing well: frequent visits. Going badly: one-time visits; a forgettable experience.
See formula
customers who return in the period ÷ total customers
Warning sign: you have to offer discounts to sell; the experience no longer justifies the price.
Leveraging customer data: data can also be sold
Google does not charge you to search; it charges the advertiser who wants to appear when you search. Amazon recommends products based on what people similar to you bought. The supermarket loyalty card gives you points in exchange for knowing what you buy, when and how much. In all three cases, customer information becomes an asset that generates revenue.
The three numbers
- Revenue attributable to dataGoing well: a growing share of total revenue. Going badly: data piles up without generating revenue.
See formula
sale of data or insights + additional revenue from personalization - Sales lift from personalizationGoing well: a positive difference against a control group. Going badly: no difference against the control group.
See formula
conversion with personalization − conversion of the control group - Customers with complete data and consentGoing well: high coverage and good quality. Going badly: incomplete data or legal risk.
See formula
customers with a complete profile and consent ÷ total customers
Warning sign: the company accumulates data that does not turn into sales, or uses it without the customer's consent.
The mistake I see in almost every company
After more than ten years building indicator dashboards, the mistake I see most often is measuring the same things regardless of the model: total sales, sales against last year, sales by salesperson. These numbers matter, but they are rarely the first to warn you that something is wrong.
Think of a subscription company that celebrates a record number of new customers in the quarter. Sales go up and the report looks green. But if nobody looks at the cancellation rate, nobody notices that more customers are leaving than arriving. By the time total sales reflect it, the problem is months old.
Every model has its own weak point, and that is where you need to take the temperature.
If you look closely at the cards, you will see a pattern: there is almost always one indicator for growth, one for profitability per unit and one for retention or quality. Growing without profitability destroys value; being profitable without keeping customers is living on borrowed time. That is why three well-chosen numbers are enough to know whether a business is doing well or not.
What about a hardware store, a distributor or a veterinary clinic?
Small and mid-sized companies do not appear on lists of famous cases, but they combine several of these patterns every day. This is how they look in practice, and these are the numbers worth putting on the management dashboard:
Hardware store: counter sales, self-service and credit
A hardware store combines direct sales at the counter with some self-service in the aisles, and it almost always sells on credit to contractors and companies. The billing system tells you how much you sold, but money hides in other places: in inventory that does not turn over, in products that are missing when the customer asks for them, and in invoices that nobody is collecting.
- Real margin by product line and brand, not just sales by product line.
- Inventory without movement at 3, 6, 12 and 24 months: capital frozen in the warehouse.
- Overdue receivables by age and by the salesperson who granted the credit.
Warning sign: credit sales grow every month, but overdue receivables grow faster than sales.
Distributor: customer repurchases
A distributor lives on customers who order again: stores, repair shops and hardware stores that restock every week or every month. It is a repurchase business, even if nobody calls it that, and its risk is the same as in the first family: that the customer stops ordering without warning.
- Customers you are losing: who used to buy frequently and stopped, based on their own purchase history.
- GMROI: how much margin each colón invested in inventory generates, by product line.
- Orders delivered on time and in full, because an incomplete order is a sale the competition takes.
Veterinary clinic: the consultation brings the customer in; food and vaccines bring them back
A veterinary clinic is very similar to the Razor and Blade model. The consultation starts the relationship, and the steady profit lies in what repeats: the bag of pet food that runs out every so often, and vaccines and deworming treatments with known dates.
- Pet food repurchase cycle by customer: when the bag will run out and who to remind.
- Active versus inactive patients, and vaccination appointments already on the calendar.
- How full the veterinarian's schedule is, and the mix of services and products.
Warning sign: customers keep coming for consultations, but they buy pet food somewhere else.
Your company probably combines several models
Netflix is a subscription, because you pay every month. It is a flat rate, because you watch as much as you want. It is digitization, because it replaced the video store. And it leverages customer data, because its recommendations come from what you watch.
The same is true for a small business. A repair shop that sells spare parts and also offers a monthly maintenance plan combines repurchase and subscription. Identifying which patterns your company uses is the first step toward knowing what to measure.
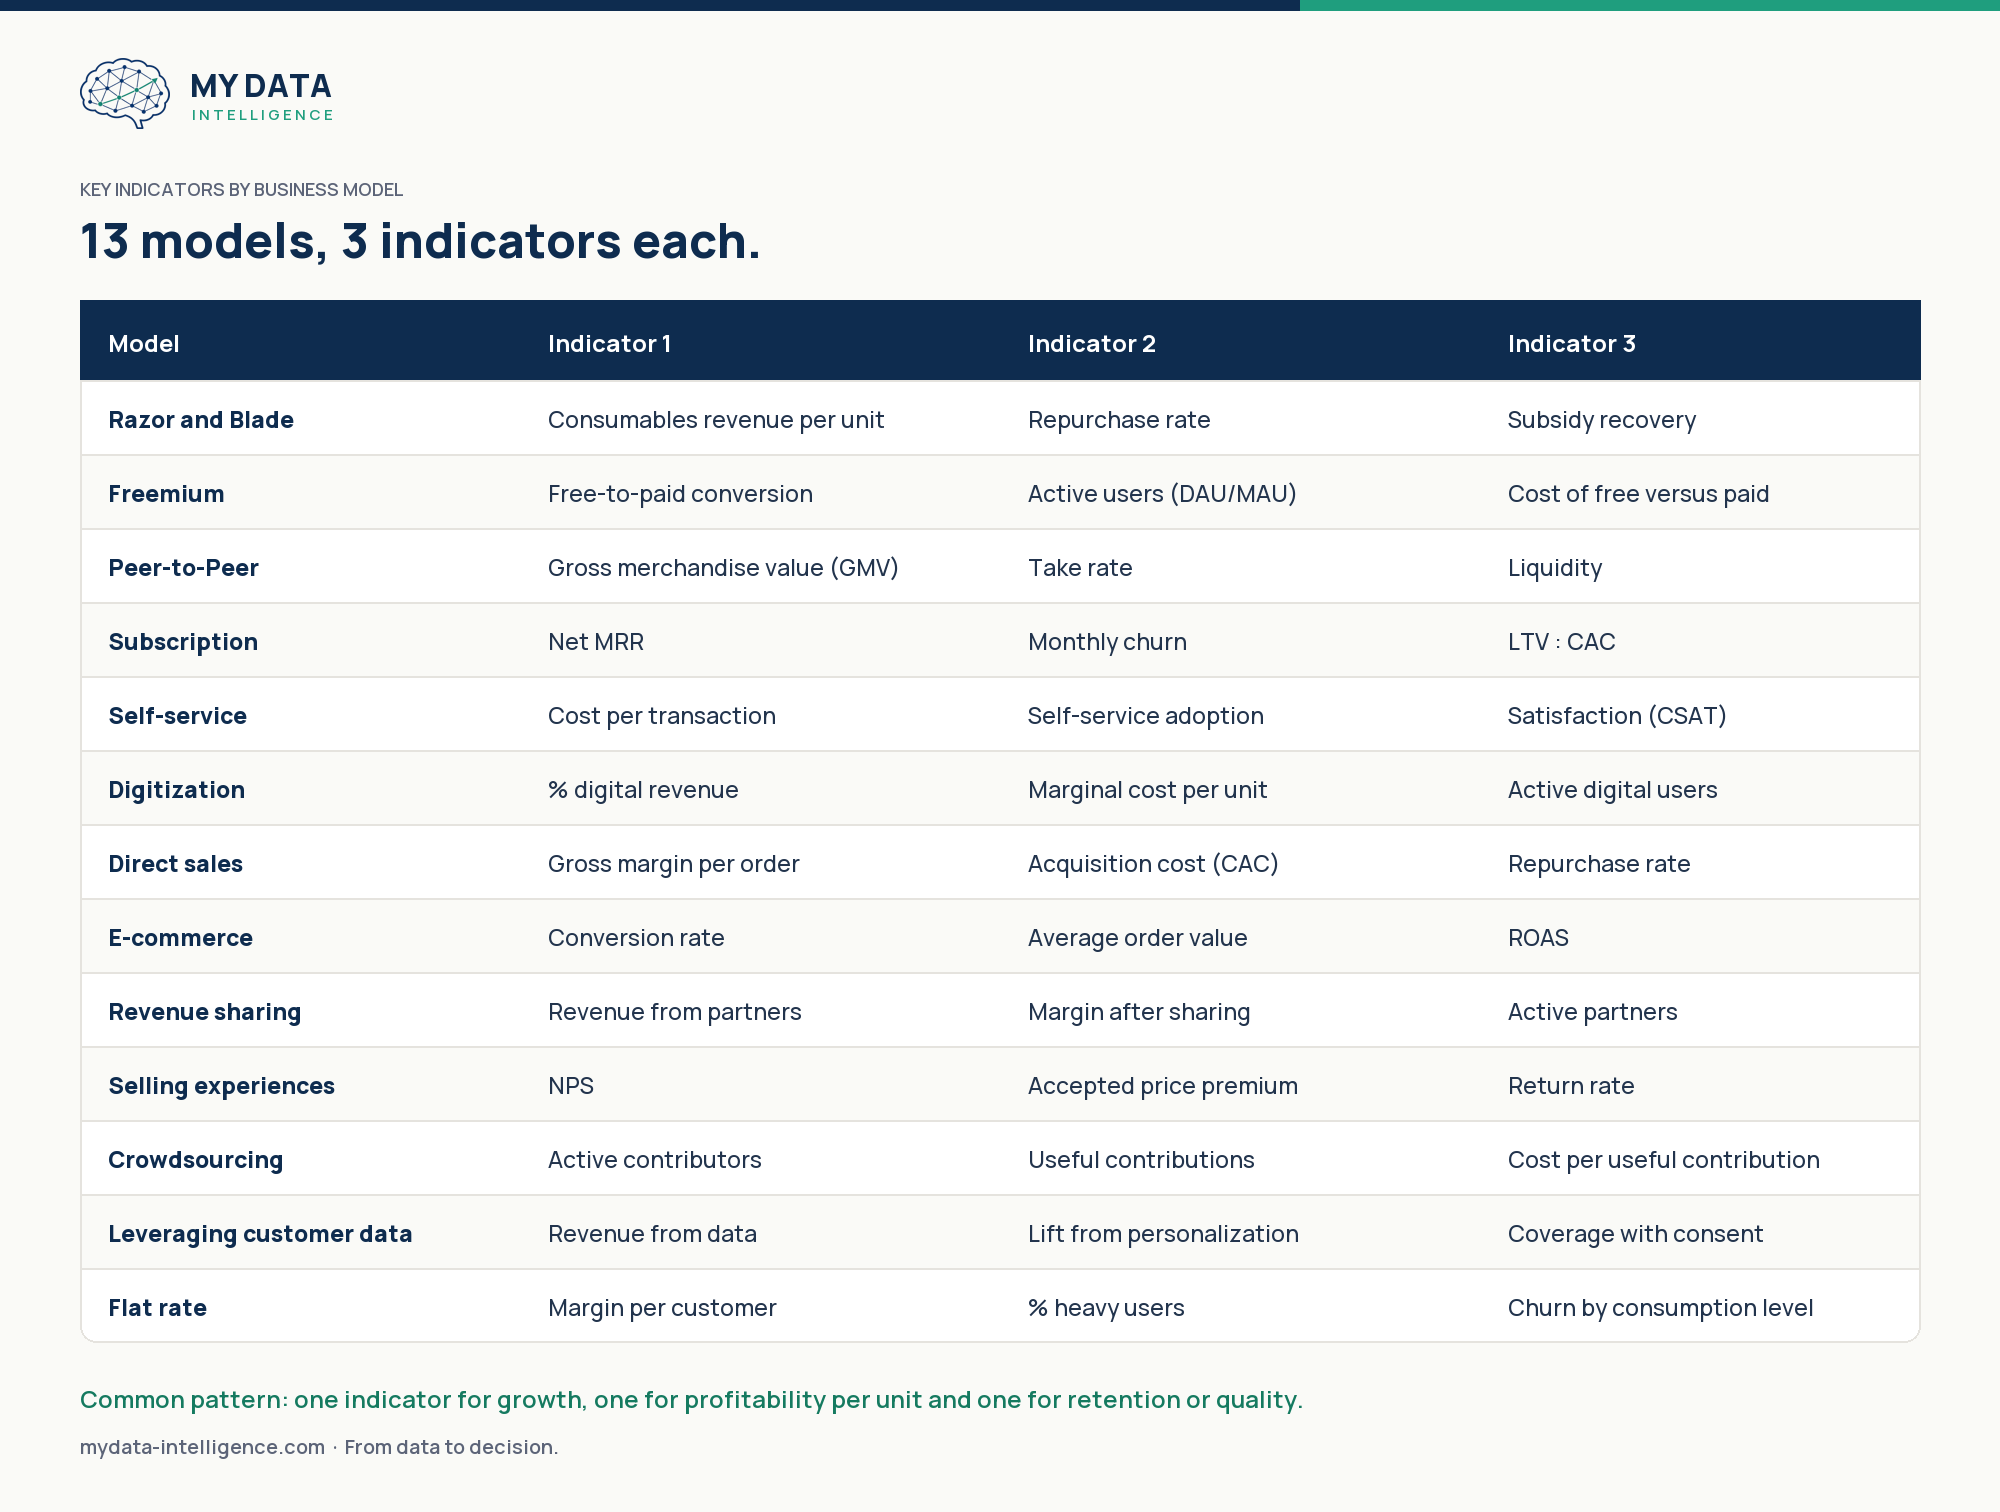
The 13 models and their indicators at a glance
Keep this table. It is the short version of the whole article: three indicators per model.
| Model | Indicator 1 | Indicator 2 | Indicator 3 |
|---|---|---|---|
| Razor and Blade | Consumables revenue per unit | Repurchase rate | Subsidy recovery |
| Freemium | Free-to-paid conversion | Active users (DAU/MAU) | Cost of free versus paid |
| Peer-to-Peer | Gross merchandise value (GMV) | Take rate | Liquidity |
| Subscription | Net MRR | Monthly churn | LTV : CAC |
| Self-service | Cost per transaction | Self-service adoption | Satisfaction (CSAT) |
| Digitization | % digital revenue | Marginal cost per unit | Active digital users |
| Direct sales | Gross margin per order | Acquisition cost (CAC) | Repurchase rate |
| E-commerce | Conversion rate | Average order value | ROAS |
| Revenue sharing | Revenue from partners | Margin after sharing | Active partners |
| Selling experiences | NPS | Accepted price premium | Return rate |
| Crowdsourcing | Active contributors | Useful contributions | Cost per useful contribution |
| Leveraging customer data | Revenue from data | Lift from personalization | Coverage with consent |
| Flat rate | Margin per customer | % heavy users | Churn by consumption level |
From data to decision
You do not need fifty reports. You need the three numbers that reveal your business model, up to date and in one view, so you can review them every Monday and decide.
At My Data Intelligence we help general managers identify those indicators and turn them into a management dashboard that updates itself, connected to the billing, inventory and accounting systems your company already has.
Frequently asked questions
What is a business model, in simple terms?
It is the way a company makes money: what it offers, to whom, how it produces and delivers it, and why that sale is profitable.
Which indicators should a general manager track?
The ones that reveal your business model. A good rule is to choose three: one for growth, one for profitability per unit and one for retention or quality.
Why does my company sell more but earn less?
Usually because the cost of each sale is rising (discounts, shipping, advertising or credit), or because profitable customers are leaving while less profitable ones arrive. Total sales do not show this; margin per order, overdue receivables and repurchase rate do.
How many KPIs should a management dashboard have?
Only a few. Three well-chosen indicators per business model say more than fifty reports. The detail remains available for those who need it, but the manager's view should fit on one screen.
Do I need Power BI to measure these indicators?
Not to get started: many can be calculated in Excel. Power BI makes sense when the data comes from several sources, when it must be updated every day, or when several people need the same version of the numbers.
How do I start measuring the indicators of my small business?
Identify which business models your company combines, choose the three numbers that reveal each one and review them every week. At My Data Intelligence we carry out that assessment with your own data.
Reference: the business model patterns come from the Business Model Navigator by Oliver Gassmann, Karolin Frankenberger and Michaela Csik (University of St. Gallen). The reference figures on the cards are guidelines only.

Founder of My Data Intelligence. Heredia, Costa Rica.